The Mott Transition in DMFT: Phase Diagram and V₂O₃

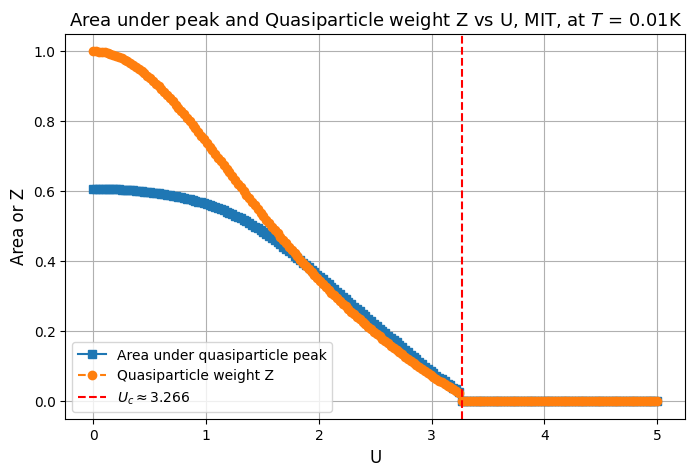
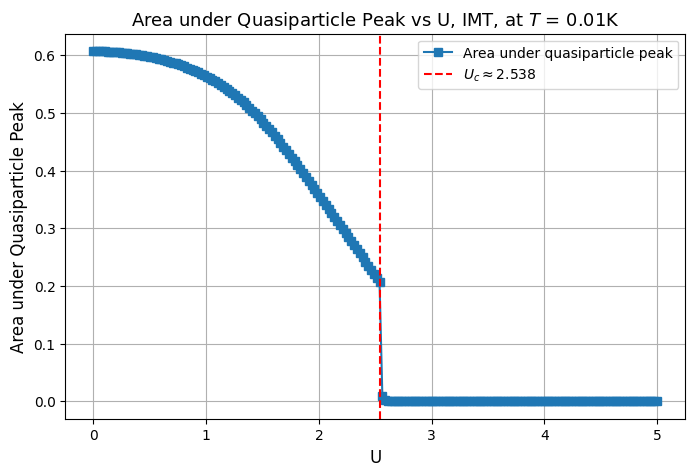
Running the DMFT+IPT loop on the Bethe lattice traces the interaction-driven Mott transition — the three-peak spectral structure, the Fermi-liquid self-energy, the coexistence region with critical interactions U_c1 ≈ 2.54 and U_c2 ≈ 3.27, and a (U,T) phase diagram whose first-order line and critical endpoint reproduce the paramagnetic metal–insulator transition of V₂O₃.

research evergreen Computation Experiment updated 2026-06-21

Methods Dynamical mean-field theory

With the DMFT formalism and the IPT solver in place, we now run the loop on the Bethe lattice and follow the half-filled Hubbard model across the Mott transition.

Extreme limits

We first check the two solvable limits against earlier results. At a single band crosses the Fermi level with no gap — a non-interacting metal. At large (the atomic limit) the spectral function collapses into two well-separated Hubbard bands — a Mott insulator. Running a single DMFT iteration at with the second-order solver reproduces, up to numerical broadening, the two sharp peaks at of the single-site problem.

Metallic phase (U=0): a single quasiparticle band at the Fermi level.
Insulating limit (large U): two well-separated Hubbard bands — a Mott insulator.
A single DMFT iteration at U=4: the impurity spectral function shows two sharp peaks at ±U/2, matching the atomic limit.
Spectral functions in the limiting cases, illustrating the passage from a non-interacting metal to a Mott insulator.

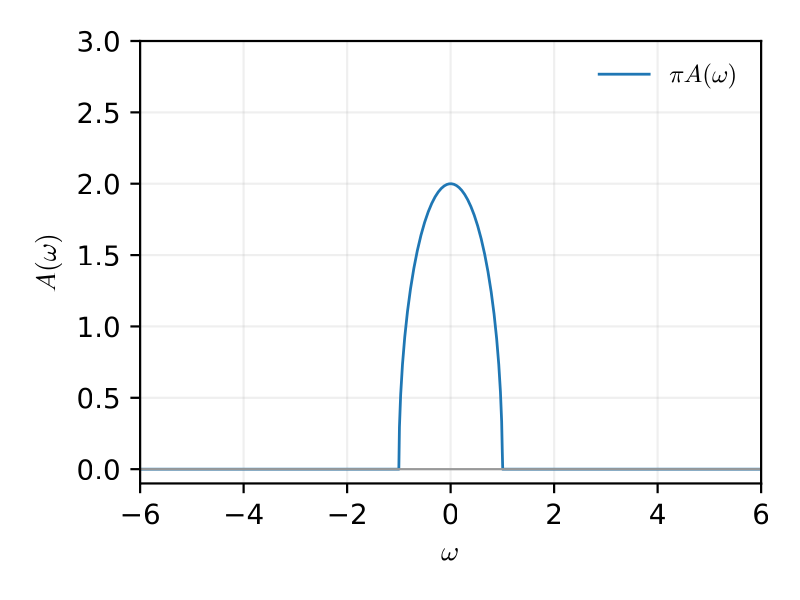
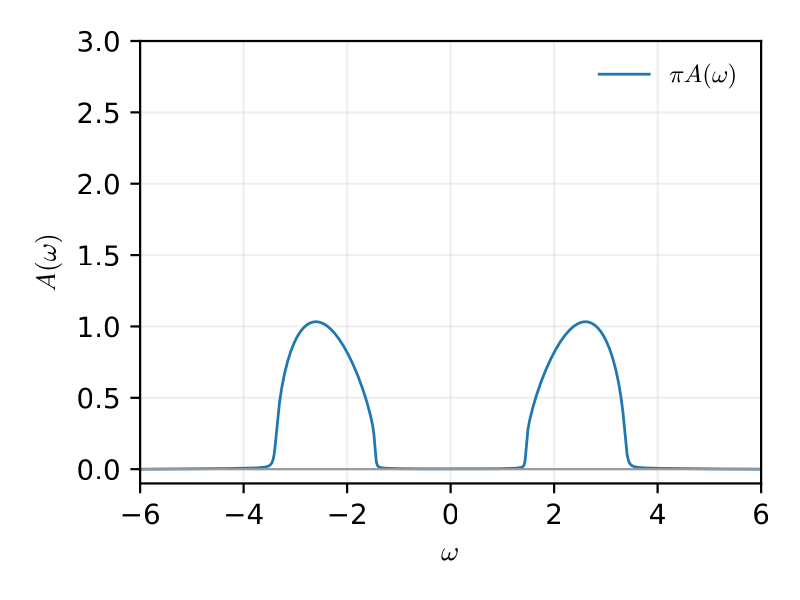
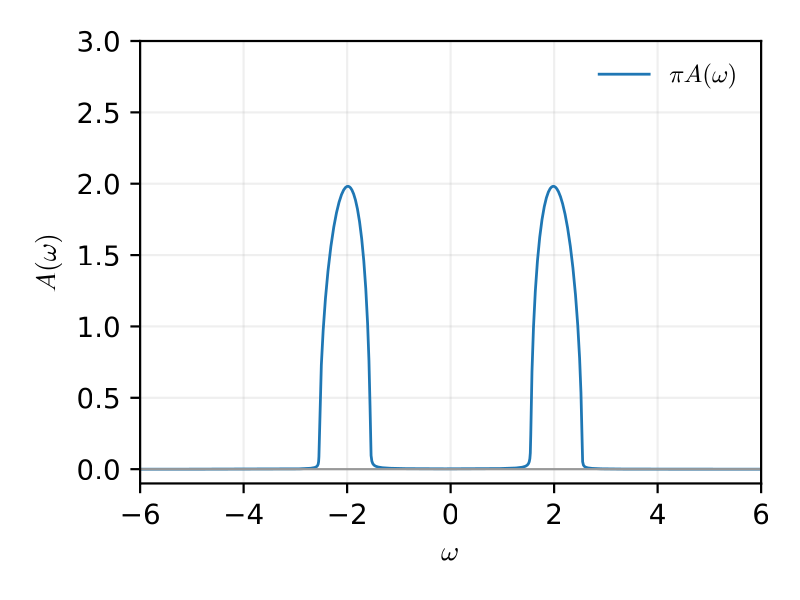
The quantum phase transition
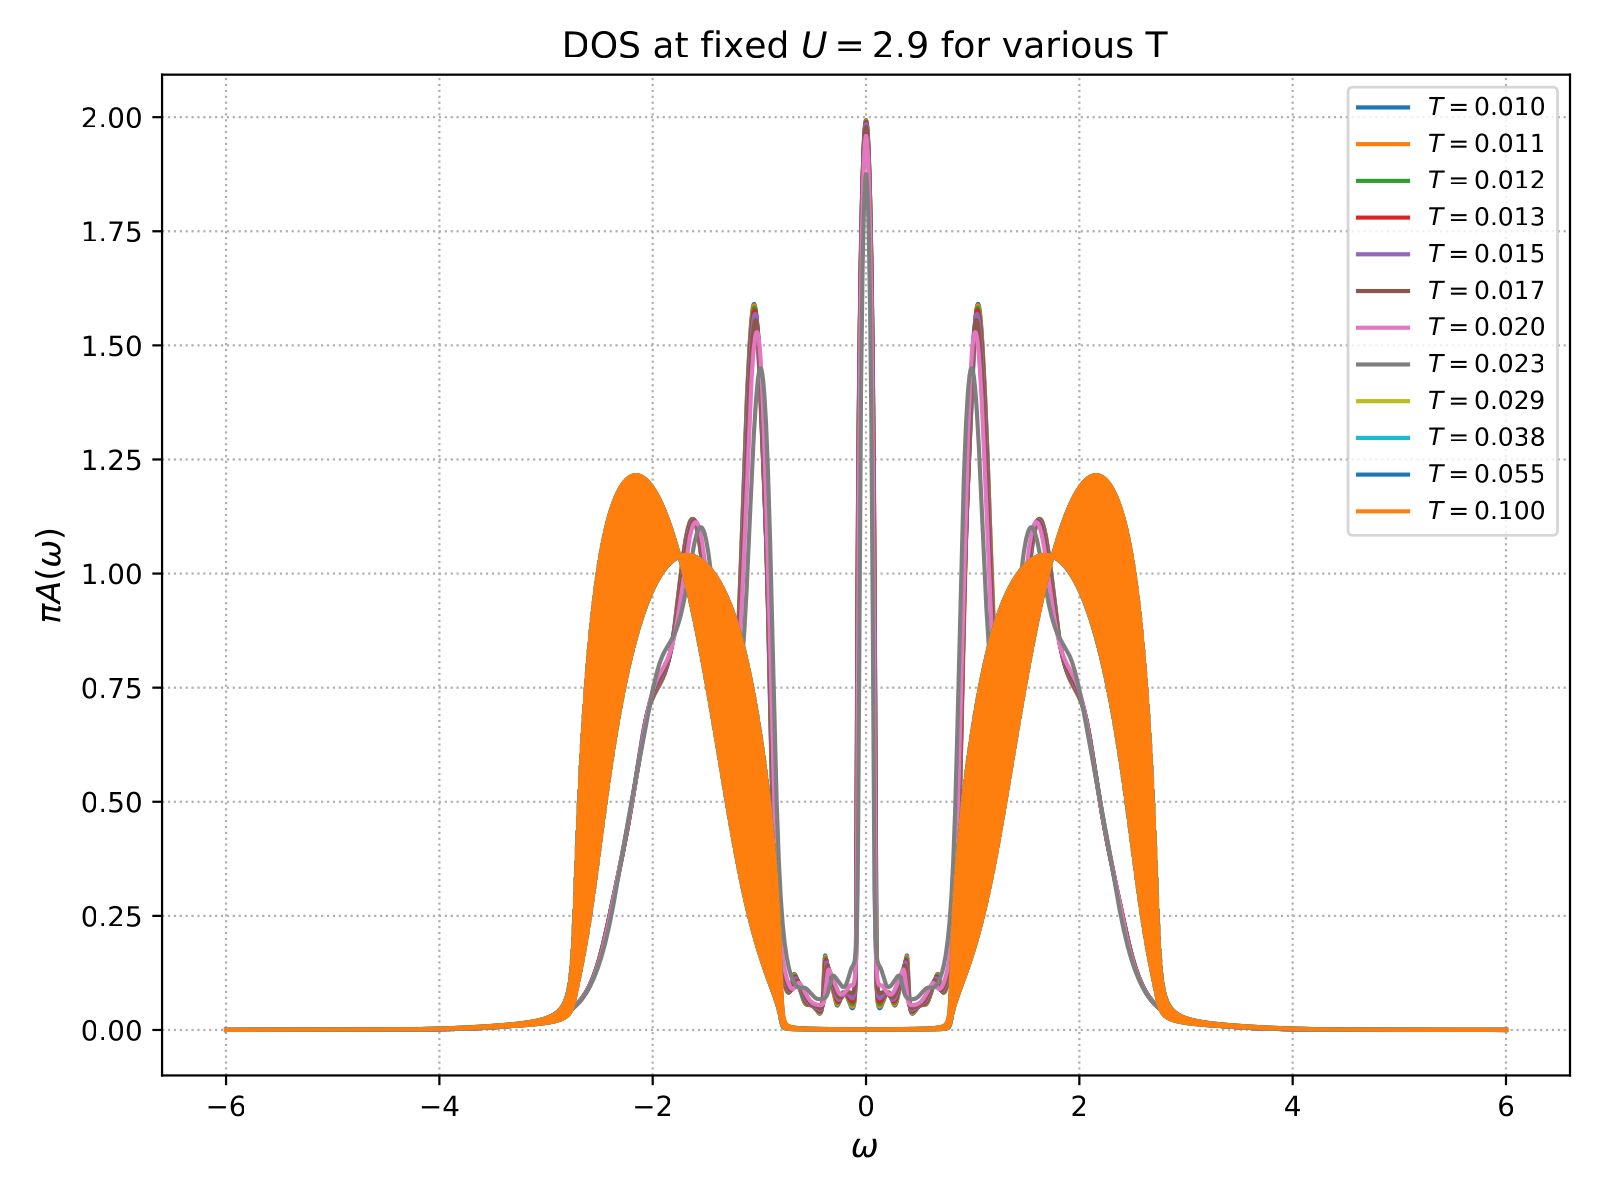
Fixing and increasing , spectral weight transfers from the central quasiparticle peak at toward the Hubbard bands — an interaction-driven transition. The signature DMFT result is the three-peak structure at intermediate coupling: a coherent quasiparticle peak of weight at , flanked by two incoherent Hubbard bands. As grows the quasiparticle weight shrinks, the peak narrows into a heavy Fermi liquid, and at it vanishes, leaving a Mott gap.

Evolution of πA(ω) with U at T=0.01t: (a) U=0 metal; (b) U=1 peak narrows, sidebands emerge; (c) U=2 the three-peak structure; (d) U=3 a sharp heavy-FL peak; (e) U=4 the quasiparticle peak is gone — only Hubbard bands remain.

This spectral function is not just a computed curve — it is measured.

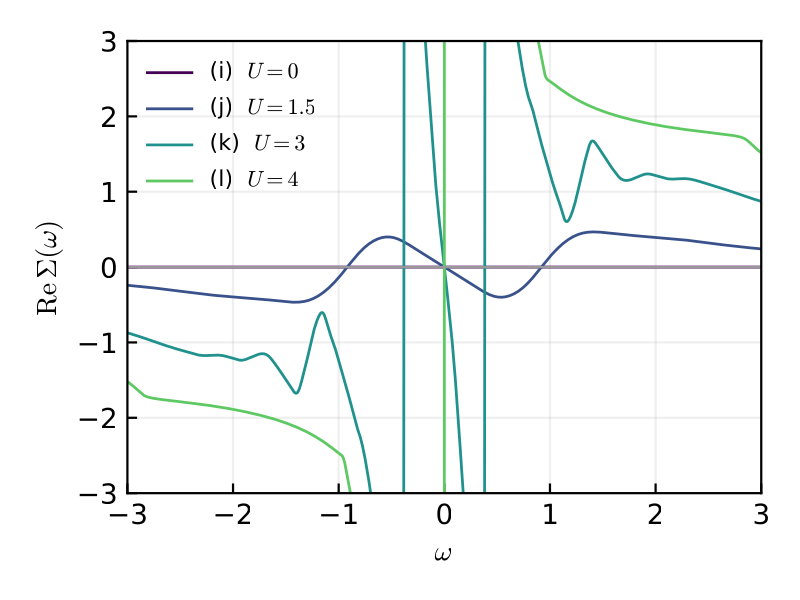
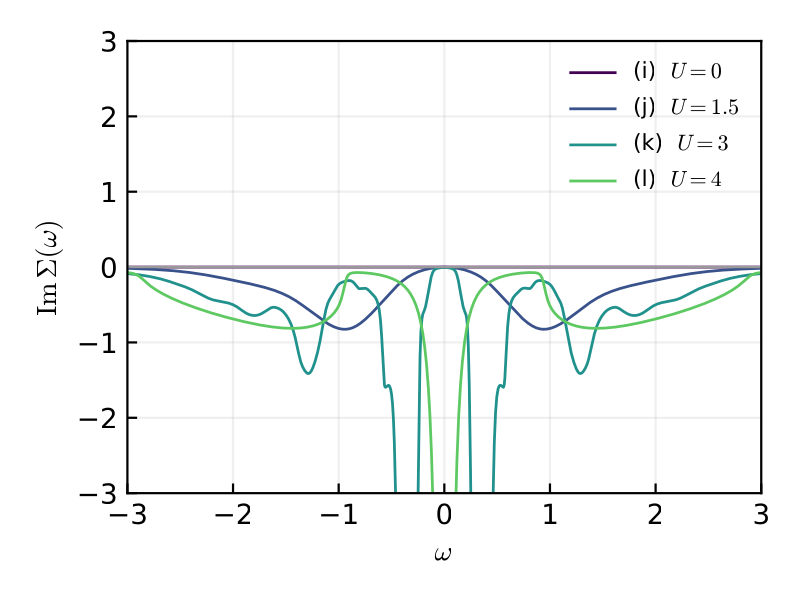
A Fermi-liquid criterion from the self-energy

The self-energy cleanly distinguishes the phases. In the metal, near , and with — Landau Fermi-liquid behaviour, giving infinite quasiparticle lifetime at the Fermi level and a finite weight . Increasing steepens the slope of (smaller ) but preserves the low- scaling. Once insulating, the self-energy develops a pole at : diverges, is large, the quasiparticle peak is cut off and a Mott gap opens.

Real part Re Σ(ω): linear in ω (Fermi liquid) at small U; the slope steepens and diverges approaching the Mott transition.
Imaginary part Im Σ(ω): ∝ ω² (finite Z) in the metal; large at low ω with a pole at ω=0 in the insulator.
DMFT self-energy near the Fermi level at T=0.01t for U=0, 1.5, 3.0, 4.0. For U≤1.5 the system is a Fermi liquid (Re Σ ∝ ω, Im Σ ∝ ω²); at U=4 a pole develops at ω=0, signalling the insulator.

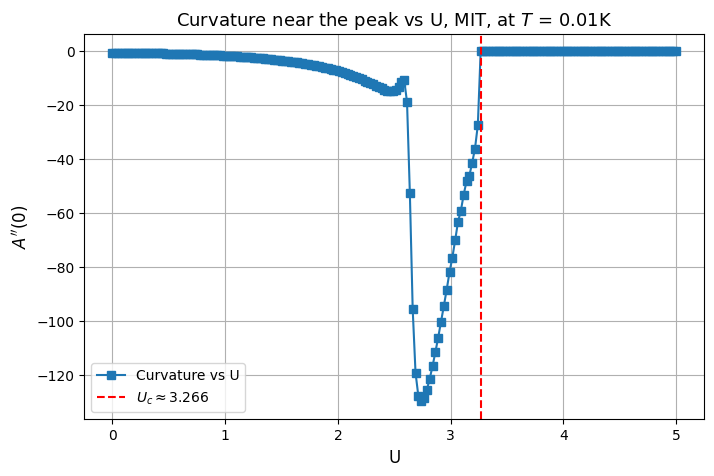
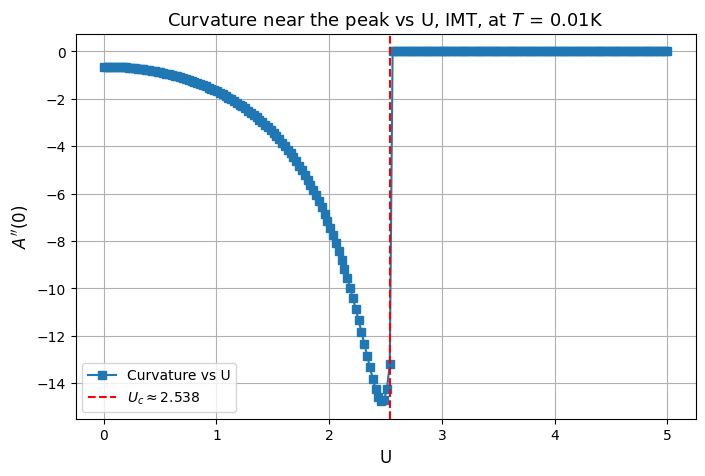
Order parameters and the coexistence region

We characterize both the metal→insulator (MIT) and insulator→metal (IMT) transitions, scanning in each direction at . The finite broadening from analytic continuation smears the gap and makes ill-defined near the transition, so we use the curvature of the spectral function at as a unified order parameter — it tracks the coherent peak in the metal and its replacement by a dip in the insulator. The transition is first order with a coexistence region: both solutions are locally stable, and which one the loop converges to depends on the initial condition (hysteresis). We extract

MIT: the quasiparticle weight Z and coherent-peak area vanish sharply at U_c2 ≈ 3.266.
IMT: scanning down in U, the peak area grows continuously, vanishing abruptly at U_c1 ≈ 2.538.
MIT: the spectral curvature at ω=0 drops and changes sign at the transition.
IMT: the curvature likewise tracks the disappearance of the quasiparticle peak.
DOS near U_c2: as U → U_c the central peak loses weight to the Hubbard bands.
DOS near U_c1: the Hubbard bands collapse and a central coherent peak re-emerges.
Order parameters and spectral features across the metal→insulator (MIT) and insulator→metal (IMT) transitions at T=0.01t. The sharp change in quasiparticle features fixes the critical points U_c1 ≈ 2.538 and U_c2 ≈ 3.266, and reveals the coexistence region.

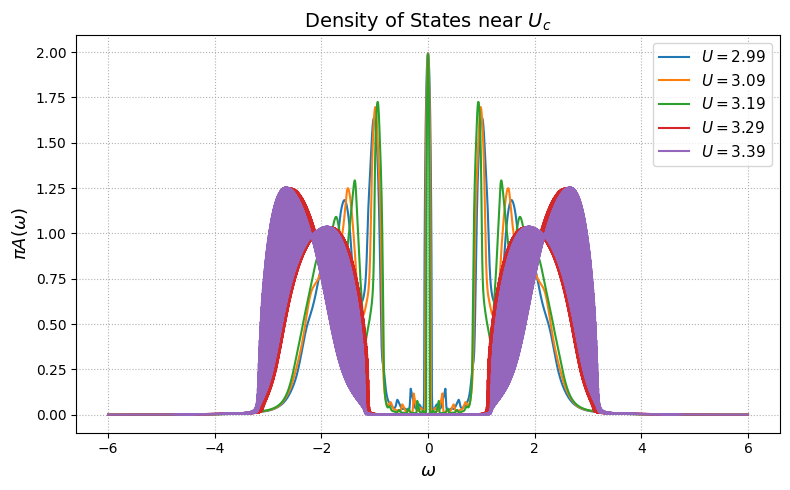
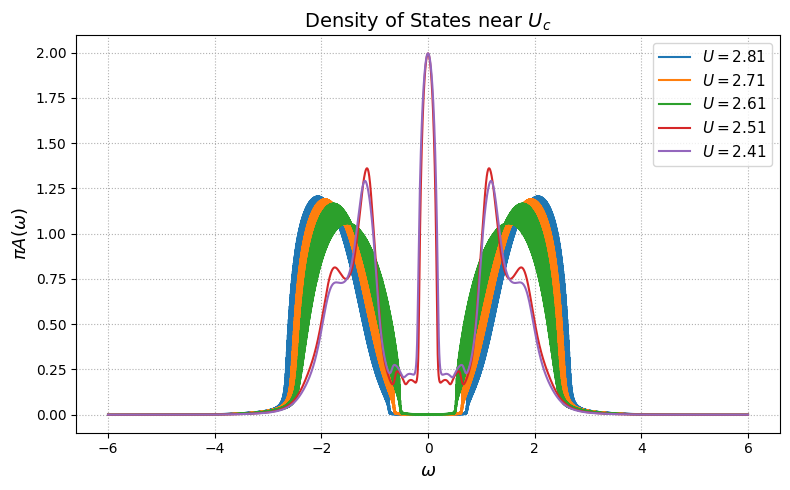
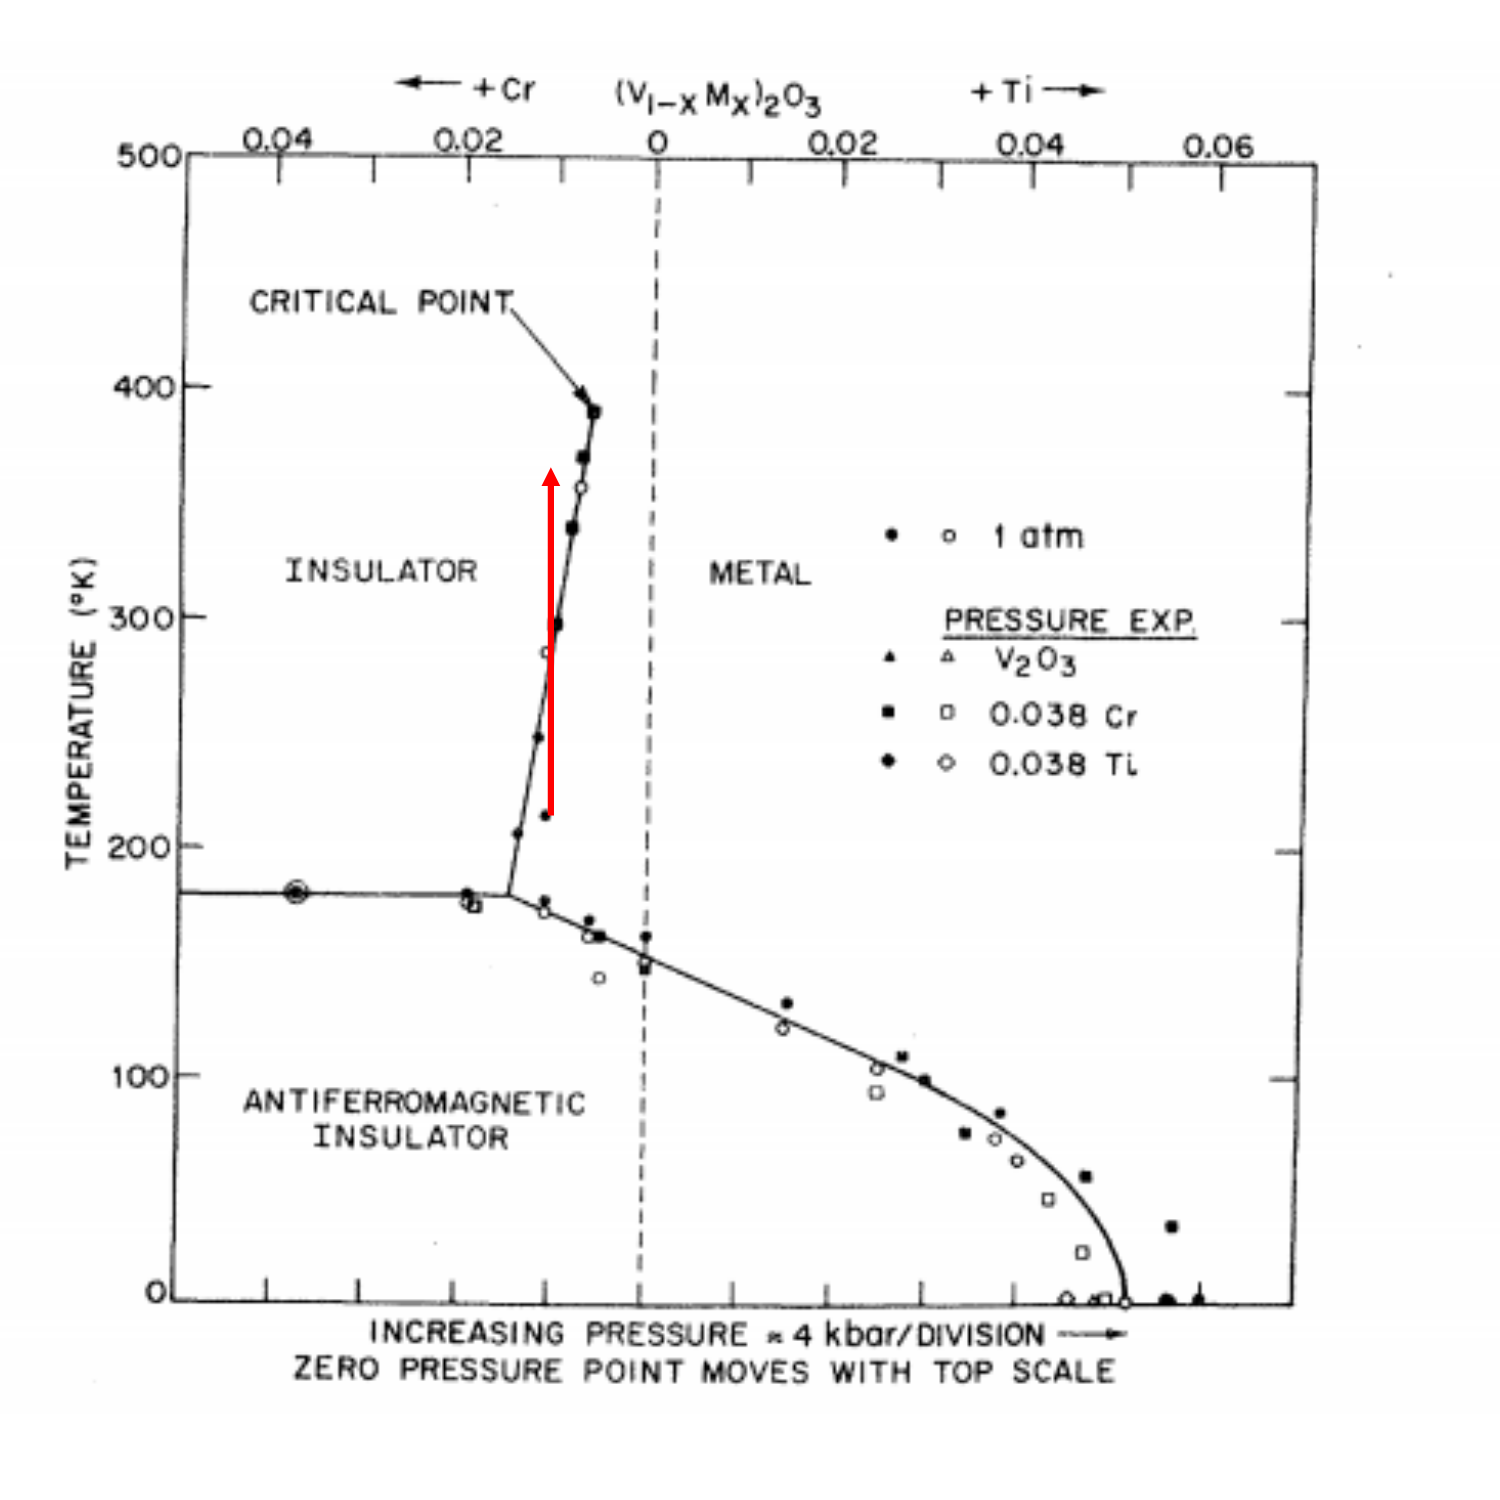
The DMFT phase diagram and V₂O₃

Collecting the critical interactions across temperature gives the canonical Mott phase diagram in the plane: a metallic phase, an insulating phase, and a coexistence dome where for two solutions coexist in , ending at a critical endpoint . Along a fixed- cut inside the dome (e.g. ), raising drives a first-order metal→insulator transition.

DMFT phase diagram on the Bethe lattice: the gray coexistence region holds both metal and insulator solutions; the dome ends at a critical point (U_c, T_c). The black arrow marks a fixed-U cut at U=2.9.

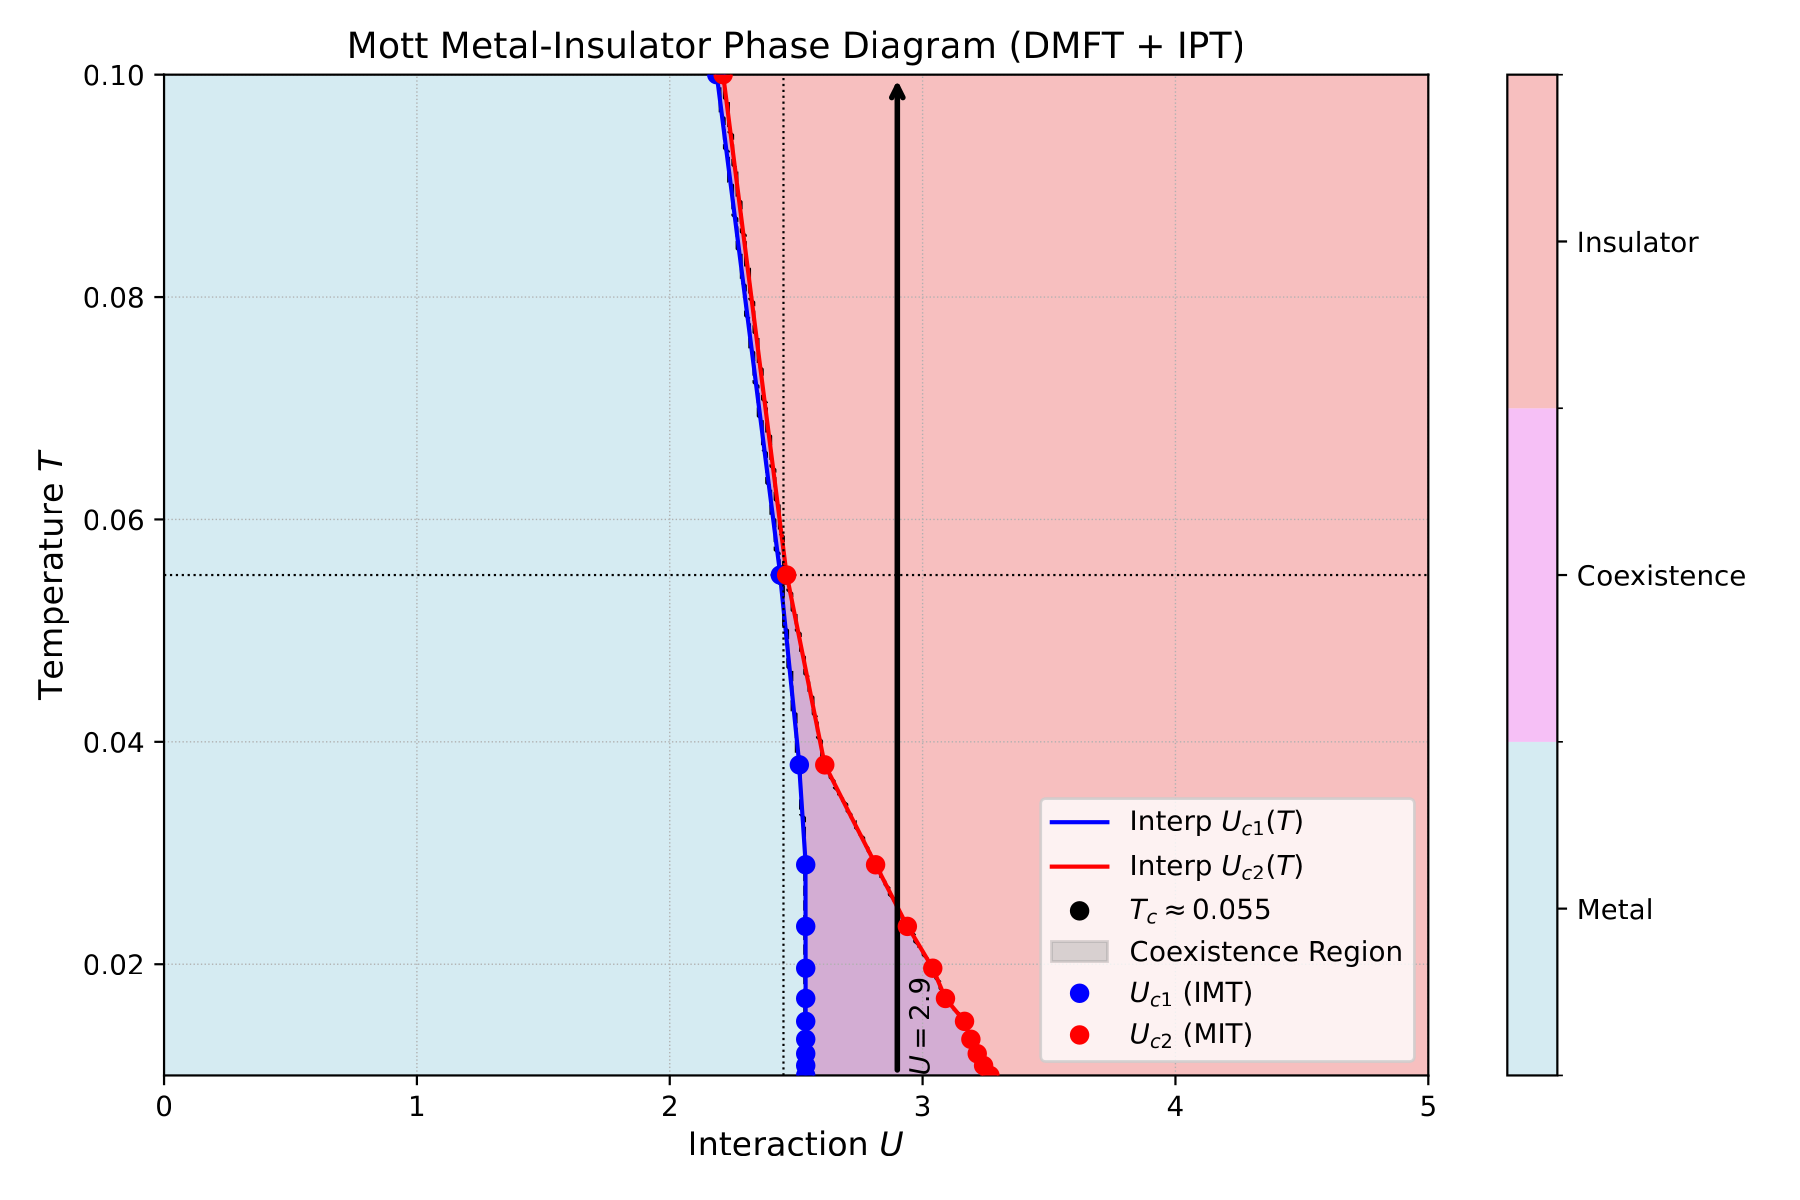
Although obtained in the idealized infinite-dimensional limit, this topology matches experiment. Cr-doped undergoes a first-order paramagnetic-metal → paramagnetic-insulator transition with a critical endpoint — exactly the DMFT topology. Along the fixed- cut, the spectrum has a sharp quasiparticle peak at low that abruptly vanishes above a threshold, leaving Hubbard bands and a gap: a thermally-induced metal → insulator transition, counter to the naive intuition that heating aids conduction.

Experimental phase diagram of Cr-doped V₂O₃ (McWhan et al., 1973): a first-order paramagnetic metal–insulator transition with a critical endpoint — the topology DMFT predicts.
Spectral evolution along the fixed-U cut at U=2.9: increasing T drives a first-order metal→insulator transition.
Comparison between DMFT predictions and experiment in V₂O₃.

Conclusion

We followed the metal–insulator transition of the half-filled Hubbard model from every useful vantage point. We set the physical stage with the high- cuprates — strongly correlated materials whose parent compounds are Mott insulators — and introduced the single-band Hubbard model as the minimal description, with its competition between kinetic energy and on-site repulsion.

Analytically, two limits: a weak-coupling mean-field decoupling gave an interaction-induced Slater gap from Fermi-surface nesting and antiferromagnetic order; a strong-coupling expansion in gave an effective Heisenberg model with superexchange . These clarified the passage from band insulator to Mott insulator with localized moments.

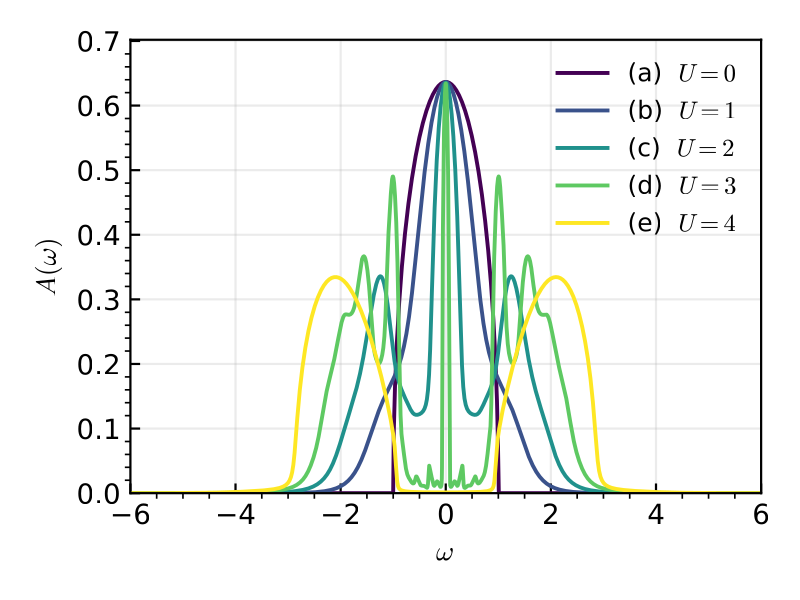
To reach the intermediate regime, DMFT with the IPT solver gave the spectral function’s three-peak structure, the spectral-weight transfer to the Hubbard bands, and the first-order Mott transition with coexistence and hysteresis. From the self-energy and spectral curvature we extracted the critical interactions and built a phase diagram that qualitatively reproduces canonical Mott systems such as .

In sum, the Hubbard model with DMFT provides a unified description of itinerant and localized phases in correlated electrons — a foundation for extensions to doped systems, cluster DMFT, or multiorbital models closer to real materials. The full report, with all references and additional detail, is on the Report page.